
Jimmy Cornell
Jimmy Cornell, the dean of bluewater voyaging and planning and a CW contributing editor, has, along with his son, Ivan, just released Cornell’s Ocean Atlas: Pilot Charts for All Oceans of the World (2011; Cornell Sailing Publications, $100). CW editor Mark Pillsbury had the following question-and-answer exchange with Jimmy, who is soon to embark on a tour of U.S. boat shows that includes appearances at Strictly Sail events in Chicago, Miami, Oakland, and at next fall’s U.S. Sailboat Show in Annapolis.
Cruising World readers can email cw@cornellsailing.com to take advantage of a special introductory price of $90, which includes free shipping within the United States.
CW: Jimmy, for sailors who are perhaps headed offshore for the first time, can you explain what the Atlas is and how you might use it for voyage planning?
J.C.: All sailors, even experienced ones, planning to set off on a shorter or longer offshore passage are concerned about what kind of weather they might encounter. The wise navigator will prepare for the worst eventuality but do everything possible to avoid it. The main role of the Atlas is to allow you to check out wind conditions for every month of the year in any ocean of the world and thus gain an immediate overall knowledge of what you can expect at any given time of year.
The Atlas contains 60 monthly up-to-date pilot charts that show wind speed and direction, current rates and direction, the most common tracks of tropical storms, the mean location of high-pressure cells for each hemisphere, and the approximate extent of the Intertropical Convergence Zone, commonly known as the doldrums. This is the kind of information you need even before you start actually planning a specific voyage, as it will allow you to decide straight away whether your plan is feasible. Once you’ve decided that it is, you can proceed to the next stage, and that’s to plan a voyage along a route that has the best chance of favourable sailing conditions. And this is where the rest of the Atlas comes to your help. Side by side with the monthly charts are 69 detailed charts of the most commonly sailed transoceanic routes. Even sailors with limited offshore experience will find it easy to plan a route that takes best advantage of the prevailing weather conditions at the chosen time of year. Sidebars with tactical suggestions have been added to the months when most passages are undertaken. The comments and tips on tactics, as well as weather overviews for each ocean, were contributed by meteorologists and routers specializing in those oceanic areas. Furthermore, the Atlas also contains a comprehensive description of weather conditions in every ocean.
CW: So by looking at a body of water month by month, sailors can determine either the best time to make a crossing or the likelihood of the wind and weather they might expect?
J.C.: Exactly.
CW: Can you explain how you arrive at the wind averages for a particular month and how to read the arrows, or wind roses?
J.C.: The wind and current data was obtained from observations made by a network of meteorological satellites since 1987. Daily samples of the average conditions measured across the globe using various remote sensing techniques were averaged and collated by a computer program. The resulting data is displayed onto the underlying maps in wind-rose form.
The ocean charts in the Atlas show the mean wind speed and direction for every month of the year in each of the world’s oceans. On the monthly ocean charts, each wind rose is located in the center of a square covering 5 or 10 degrees square of longitude and latitude and shows the distribution of the winds that prevail in that area from eight cardinal points, both their direction and speed.
The arrows fly with the wind, and their lengths show the percentage of the total number of observations in which the wind has blown from that cardinal point. The number of feathers shows the force of the wind, which has been recorded most frequently from that sector. The wind force is measured on the Beaufort Scale, with each feather being equivalent to one unit of wind force, so that four feathers represent an average Force 4 wind from that direction for that particular month. In areas with prevailing winds, the resulting arrow would be too long to be shown in its entirety, in which case for percentages higher than 30, the percentage is shown numerically on the shaft. The figure in the center of each circle gives either the percentage of calms (less than Force 2) in blue or the percentage of storms (more than Force 7) in red, whichever is greater.
CW: Based on your experience, how closely can you rely on monthly wind and weather predictions that can be drawn from the Atlas?
J.C.: I need to stress that the pilot charts in the Atlas, and pilot charts generally, only show statistical data based on observations made over a long period of time. Such observations are averaged out for a given month, and as in the case with any statistical data, their relative accuracy depends on the number of observations, the reliability of those observations, and the method of calculation that was used. This is, in fact, the main difference between the old pilot charts and those used in this Atlas, as the data shown in some of the old pilot charts may have been derived from a relatively small number of observations, and their reliability may not have been too high. One important point in case is the direction of the wind, as the navigators who made some of those earlier observations may not have paid much attention to the difference between true- and apparent-wind speeds and direction, so it’s quite likely that a navigator on a fast clipper, or a fast container ship, may have erred on both counts. Compared to this, the data obtained from the satellites used in this program was based on millions of observations.
CW: In your experience, how accurate will the Atlas be in a given geographical area? In other words, if a sailor wanted to avoid gales in, say, an area of the North Atlantic, by how much of a distance would that area have to be skirted?
J.C.: The frequency of gale-force winds is indicated by a red figure in the center of each wind rose. Not surprisingly, the figures in high latitudes, especially in winter, tend to be high in each ocean. The frequency of gales in mid-latitudes in summer is far lower, and therefore they may not show up among the mean data calculated over an entire month, even if there may have been some spells of stronger winds. So the information contained in this Atlas may help you avoid the worst areas by choosing a route that avoids areas with a high percentage of winds stronger than Force 6. But the only way to be sure of avoiding gales in the North Atlantic is to sail a route that passes well to the south of known stormy areas.
But I must point out that anyone planning a passage through an area where there’s a probability of gale-force winds needs to be prepared, and able, to deal with such winds should they occur. A passage from North America to Europe across the North Atlantic is a good example, as even at the height of summer, it’s very unlikely that one will be able to sail some 3,000 miles without at least once having to put up with winds over 30 or even 35 knots. But at least they’ll be from behind and, as the song goes, storms never last. They certainly don’t!
CW: How does your Atlas differ from others that are currently in print?
J.C.: The data is far more accurate, as it’s based on the latest weather information gathered by a network of meteorological satellites during the last 20 years. What I need to stress here isn’t so much the importance of the data in the Atlas being as accurate as possible, but how the information shown in the old pilot charts can be misleading or possibly inaccurate. There are many examples to bear this out, but I’ll use only two, as they both refer to some frequently sailed routes and show just how much the information displayed on the new charts differs from the old pilot charts.
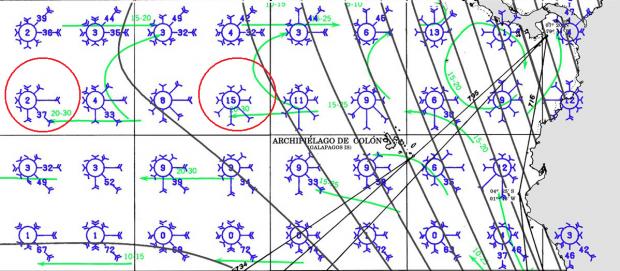
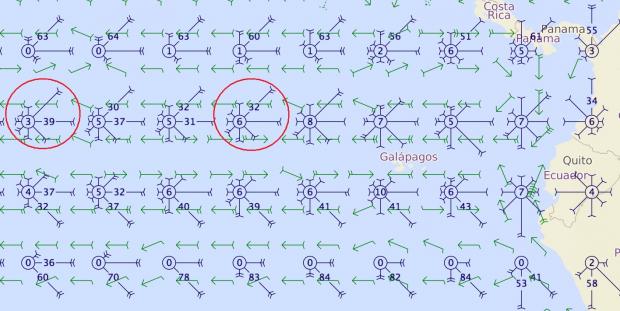
To give an idea of how much sailing conditions have changed over the years, I’ll compare the old pilot chart for the area west from Panama for the month of March with the latest data for that same area as depicted on the chart for the same month reproduced in this Atlas. The changes are quite significant, both north of the Galápagos, where northeast winds predominate north of the equator, and south and west of Galápagos, where the proportion of east and southeast winds is now shown as markedly higher than in the past. What the current pilot chart shows is that those sailors bound from Panama for the Marquesas who aren’t interested in stopping in the Galápagos may fare better by sailing southwest out of the Bay of Panama to about 4 degrees north, then continue west from there until the point is reached where the equator is crossed and the Marquesas are approached from an east-northeast direction.
North Pacific Ocean March—old pilot chart:
North Pacific Ocean March—new Atlas pilot chart:
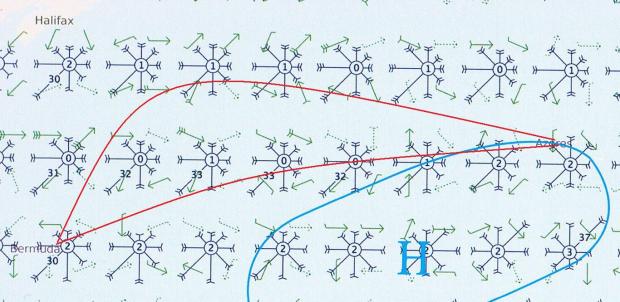
Just as significant are the changes that have occurred along the frequently sailed route from Bermuda to the Azores. In the past, the recommended tactic on leaving Bermuda was to sail northeast or even north-northeast into an area of prevailing westerly winds, make the required easting in that latitude, and only alter course for the Azores when northwest of the islands. This advice accords with the information shown on the old pilot chart for June. But the latest pilot charts from my new Atlas shows that in fact, that advice is no longer valid and that the probability of favourable winds is just as high on the more direct and shorter route. In fact, the proportion of favourable southwest and south winds isn’t much affected even if you happen to stray into the upper limb of the Azores High.
North Atlantic Ocean June – old pilot chart:
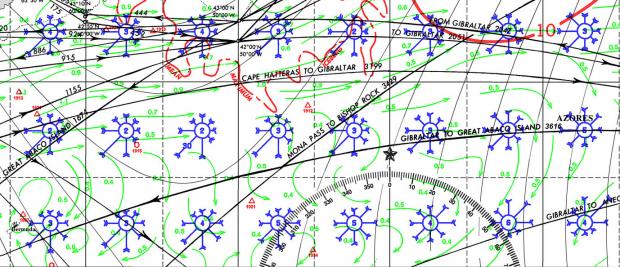
_
North Atlantic Ocean June—new pilot chart_:
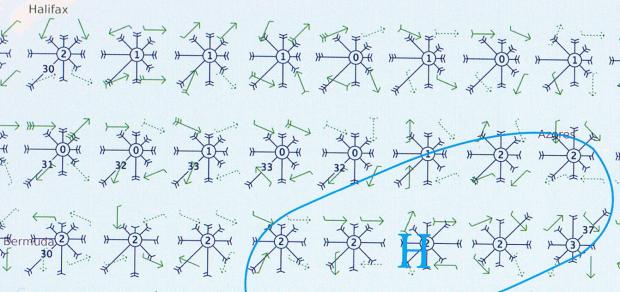
Below, the upper red line shows how the traditional route would’ve been sailed according to the information shown on the old pilot chart, while the lower red line traces a route that takes the best advantage of the information shown in the new Atlas.
I hope that these two examples show why the current pilot charts are of such relevance to sailors planning an offshore passage.
I’d like to add here that those considerable discrepancies can be due to two very different factors. They can be due to climate change but could also be explained by the fact that some of those earlier observations weren’t so accurate or were based on limited sources. This is particularly the case in less frequented areas of the oceans, both in the tropics and high latitudes, where there have been fewer observations over the years than in areas regularly crossed by commercial ships.
Another important point that I’d like to make about the difference between the old and new pilot charts in the Atlas is their clarity. The old pilot charts were conceived for the use of commercial ships, and much of the information they contain isn’t relevant to cruising boats. What’s worse, some of those charts are cluttered with too much detail, whereas the new charts only show information that is of direct relevance to cruising boats. There’s also considerably more detail on the charts depicting specific ocean areas. Whereas on the old pilot charts wind roses were usually displayed at the center of each 5 degrees square, on some of the new pilot charts, their frequency increases as much as sixteenfold.
CW: Is the Atlas the first publication a sailor should look at when planning a voyage? Or, to put it another way, are there questions that need to be answered before checking for wind, current, and other weather patterns?
J.C.: It’s not necessarily the first, although those who intend to leave on an offshore passage at some point in the future will need to buy the Atlas in any case, so they might as well buy it sooner, as it’s definitely a very useful tool and also a pleasant way to while away an evening tracing out the hypothetical route of some future voyage.
CW: What other sources of information would you find helpful when planning an offshore passage?
J.C.: This question is best answered by this extract from my forthcoming book World Voyage Planner: “For most sailors, every voyage starts with a dream, but between the fulfilment of that dream and the reality of the voyage itself lies a period of preparation during which working on a well-thought-out plan is of utmost importance.
The first planning stage is a period of research and gathering all information that may be relevant to the voyage, such as consulting cruising guides and nautical publications of relevance to the chosen route, reading books, reports, or blogs written by other sailors who’ve completed a voyage along a similar route, familiarizing yourself with weather conditions and tropical-storm seasons, researching the Internet for reports on the countries to be visited, and finding out about any specific formalities, permits, and official requirements of which you should be aware, gathering information on any high-risk areas that ought to be avoided, be it because of military conflict, political instability, the threat to personal safety, or piracy.”
CW: Based on your analysis, what areas of the globe have been most affected by changing weather patterns?
J.C.: The most obvious changes seem to have occurred in the polar areas of the planet, with a shrinking icecap in Greenland, the opening of the Northwest Passage, and the retreat of glaciers in places from Alaska to southern Chile. I myself have noticed dramatic changes between my two visits to Antarctica. But there are changes occurring also in temperate and tropical areas of the world; the more active hurricane seasons in the North Atlantic (such as in 2010) and devastating floods in some areas while others suffered from equally devastating droughts are some examples that may show that Mother Nature is trying to tell us something.
CW: What’s one trick, or rather, piece of know-how that you could share with readers for when they sit down to use your Atlas?
J.C.: Start by reading the introduction and the first pages, as they summarize all the fundamental information that the reader ought to know about global weather conditions. It’s only after you’ve studied those pages that the rest of the Atlas not only makes real sense but also will give you the confidence that no matter how ambitious your plans may be, they’re certainly doable. The main aim of both this Atlas and its companion volume, World Voyage Planner, is not only to help sailors plan a voyage to anywhere in the world but also to show that voyage planning isn’t rocket science but a simple and highly enjoyable endeavour.
Jimmy Cornell will present offshore cruising seminars at Strictly Sail boat shows scheduled for the winter of 2012 in Chicago and Miami. Find out more here.


