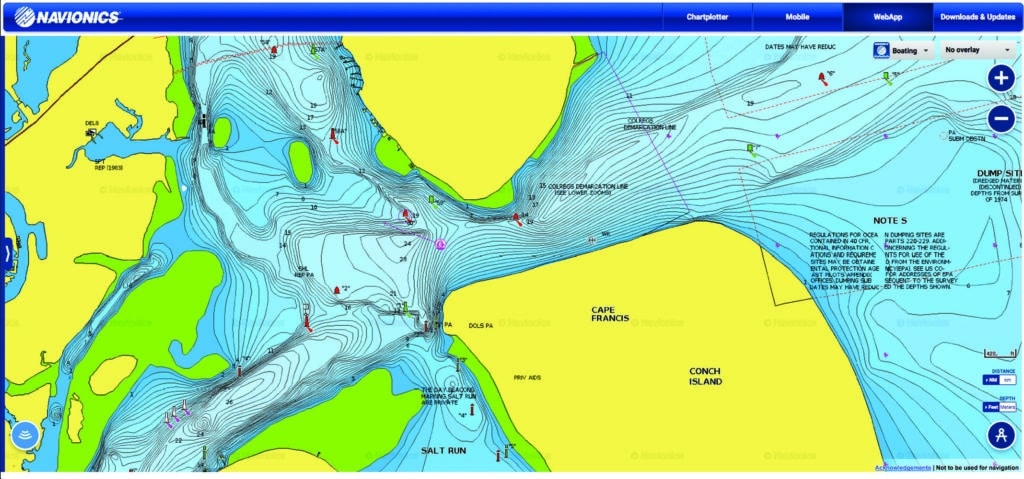
We’ve all been there. You’re underway, and the depth on the chart is not what you’re seeing on your sounder. Or perhaps there’s a channel marker that’s out of place, or a boat sunk in a narrow channel. Sharing this information — whether you’re on the giving or receiving end —has become easier than ever thanks to the quickly emerging field of crowdsourced cartography. Navigation equipment companies like Navico, Raymarine and Navionics, and coming soon, Nobeltec and Furuno, have created platforms to allow you to collect soundings and other observations as you sail, and to upload them so you can either contribute to crowd-based databases or customize charts (think fishing holes or remote anchorages) for your own personal use.
Depending on your chart plotter (or computer and navigation software) and the electronic charts it supports, you can take advantage of some or all of these new capabilities.
The basic elements to get started are a depth sounder, a chart plotter and multifunction display that can record soundings, and a way to upload that data to the Internet. Uploads can be accomplished using a newer plotter with built-in Wi-Fi capability, or with an SD card, which can store data from your plotter and then, via your home computer, upload it to the appropriate cartography provider.
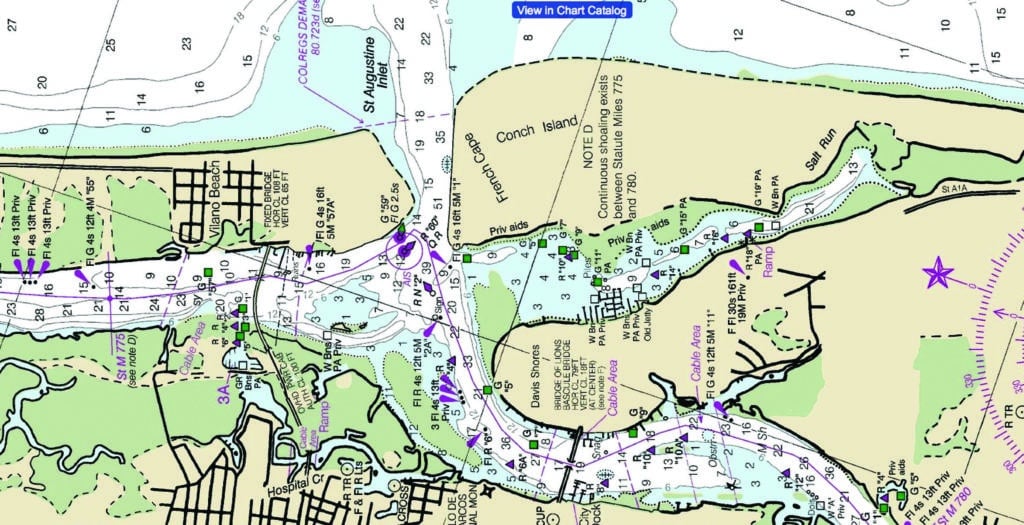
Before we get into the details, though, it should be noted that charts that include crowdsourced data are meant to be used as a supplement to official data, and manufacturers make this data viewable as a separate, removable layer or split screen with official data.
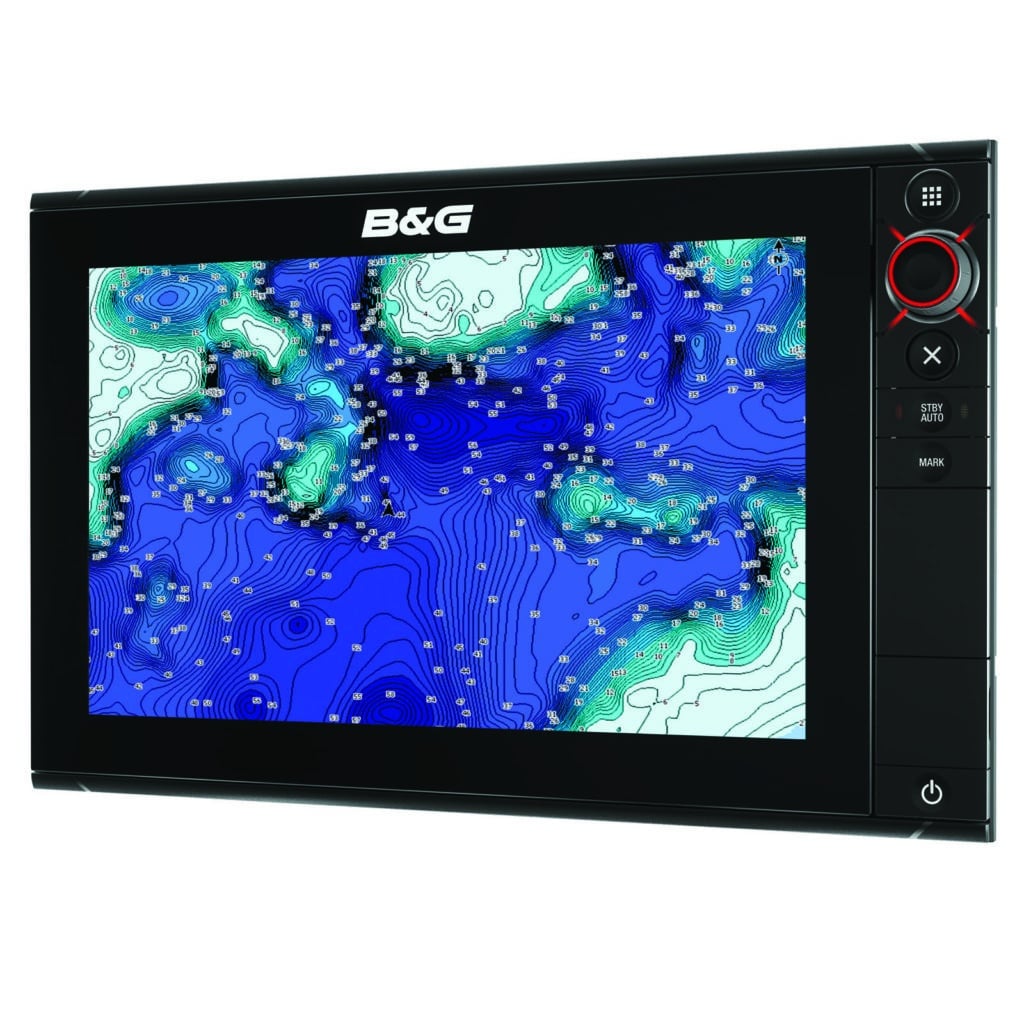
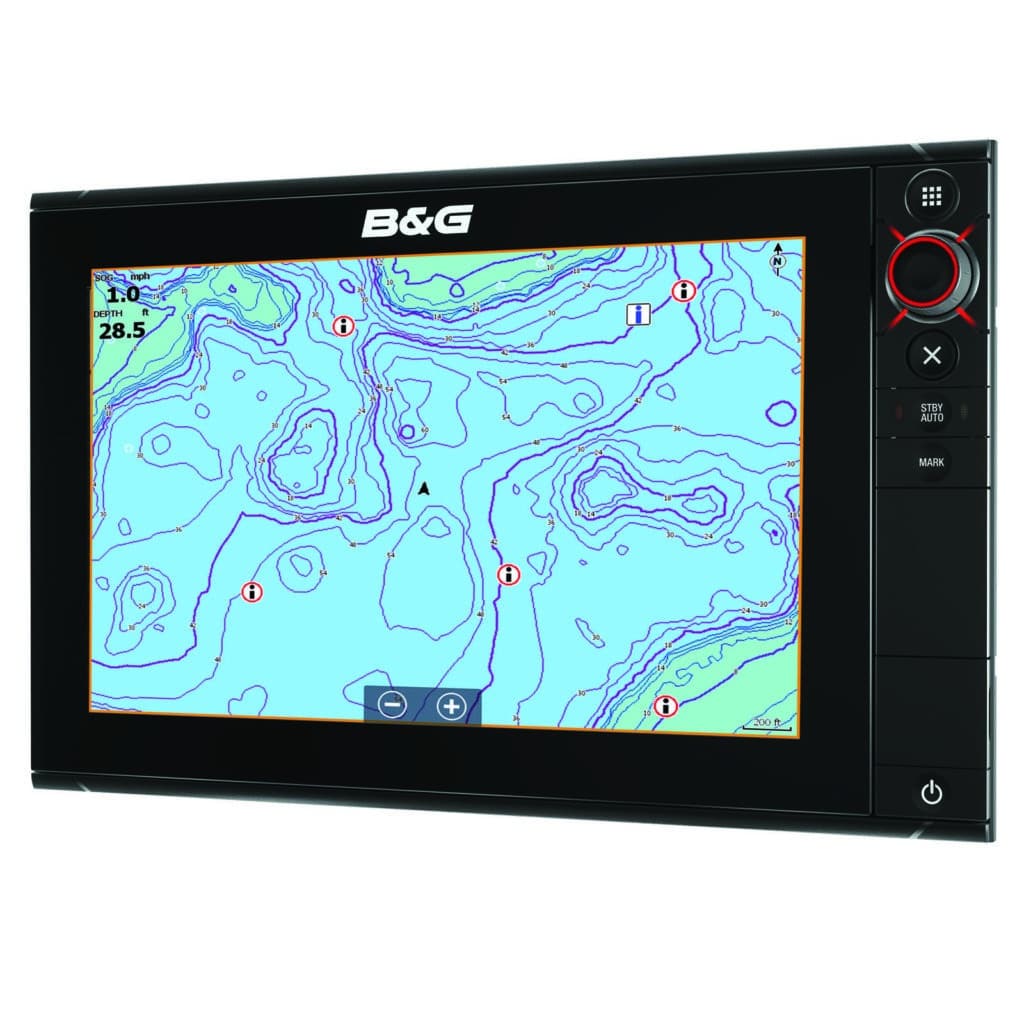
Navico, the company behind the Simrad, B&G and Lowrance chart plotters and instruments, launched Insight Genesis as a way for users to make custom charts for personal use or to share with the Insight Genesis community. Insight Genesis is part of Navico’s GoFree store, which delivers charts, software, apps and more — wirelessly — to chart plotters, MFDs, computers and mobile devices.
To use Insight Genesis, users simply create a free account and upload their sounder readings to the cloud-based servers. A custom chart is then automatically created, which you can view on a computer or download and use on your compatible chart plotter (you can keep the data private with a premium subscription). The result is a high-definition bathymetry map that shows color-coded contour lines. You can choose to keep your charts private, or as long as your data meets quality standards, it can be included as part of the publicly available Social Map.
The Social Map includes data from users as well as other sources. “We have partnered with the team at Jeppesen C-MAP and will be including their global database of coastal data,” says Navico project manager Shane Coloney. “We have also partnered with other data aggregators to include information for northern European coasts, and will continue to look for partners globally who are willing to share their data.”
Insight Genesis is currently mostly targeted at anglers and boaters on lakes and inland waterways, but this will be expanding.
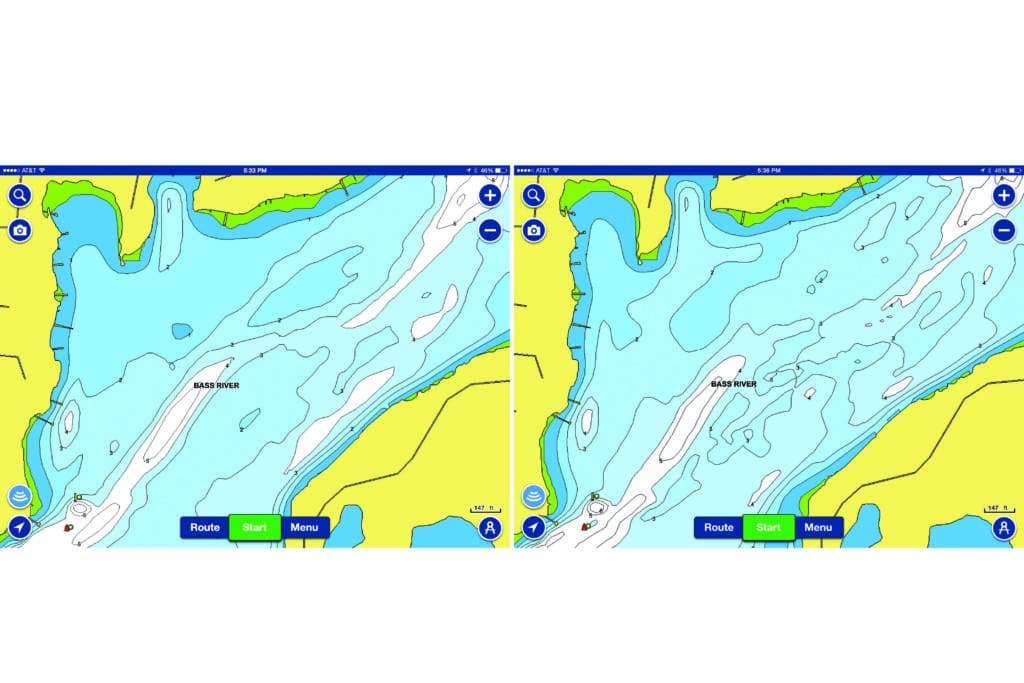
Navionics’ SonarCharts are another big player in community-sourced charting. “SonarCharts will run on most chart plotters from most manufacturers, including Simrad, B&G, Raymarine, Lowrance and Humminbird, as well as on mobile devices with the Navionics Boating application,” says Shaun Ruge, global product manager for Navionics. (Navionics has also recently launched SonarCharts for Garmin GPS, but details and availability are in flux.)
The SonarCharts data is viewable as a layer on all Navionics Platinum and Navionics Plus cartography. The user-generated soundings are found on a layer that can easily be switched on and off.
SonarCharts is more than just user-generated content. “We start with the Nautical Chart [Navionics’ standard marine chart, based on NOAA cartography], which already has data, and add in additional surveys, new data sets and most importantly, customer sonar recordings. We adjust the data for tide, then reprocess the SonarChart for redistribution via what the company calls its ‘Freshest Data’ download,” Ruge says.
Similar to Navico’s Social Map system, data for Navionics’ SonarChart can be uploaded either directly from certain Wi-Fi-enabled plotters, such as through Plotter Sync on Raymarine MFDs, or by loading the data from an SD card. Once the data is uploaded, both companies put the soundings through a sort of quality control before including them in the community-sourced charts. Navico’s Coloney adds: “I think we have done a good job curating the data through both automatic systems and by individual human review, and have avoided any significant issues related to erroneous data. The amount of data we actually reject from inclusion in Social Map is pretty significant, so while we will always process an individual user’s trips for his or her own review, we have an even higher standard when it comes to including that data in Social Map.” “There is a processing team as well as a host of quality checks that analyze each log for errors or bad data,” says Navionics’ Ruge. “The resulting SonarChart is also quality controlled before release. All marine tracks are adjusted for time and tide.”
Another company that will be on the community-sourced charting scene soon is Nobeltec, which uses the brand name MaxSea outside of North and South America. The company develops navigation software for PCs, iPads (a product for Android tablets is in the works) and Furuno MFDs. “All the products, Nobeltec software and Furuno MFDs, share the same TimeZero technology, and we are now consolidating a community supporting this technology,” Brice Pryszo, president of Nobeltec, says. “For that purpose we have developed a dedicated cloud infrastructure that will be the core of the various community features.”
The new community layer will be available on the MapMedia charts used by Nobeltec on the Furuno NavNet 3D, TZtouch and TZtouch2 MFDs. It will allow users to add, modify or remove chart data. “When users create a community input, it will be displayed immediately with a specific icon on the user’s product,” Pryszo explains.
“Community data is then sent to the MapMedia server in the cloud, and after approval by MapMedia, community data can be made available for everybody and will display with the regular community icon.”
Sharing of bathymetric data is also in the works. Pryszo says any TimeZero product connected to an echo sounder will be able to collect depth data (a user can turn this function on or off). When connected to the Internet, the collected data will be sent automatically to the MapMedia server in the cloud. “MapMedia has developed some specific big-data technologies in order to efficiently process huge amounts of discrete bathy data and to create accurate depth elevation models,” Pryszo says. “From this improved model, MapMedia produces bathymetry MM3D data, which is used to display depth shading and 3-D mode, and makes it available from the cloud to TimeZero users through chart updates.” There are other cool features in the works from Nobeltec, so stay tuned.
With all these developments in charting technology, it’s easy to wonder if traditional surveys by institutions such as NOAA will begin including community-sourced data in official charts as well. Rear Admiral Gerd Glang, director of NOAA’s Office of Coast Survey, offers his take: “We view the navigation-electronics industry’s development of crowdsourcing marine navigation information as a good thing. But what we really would like is for this industry to share the data to improve the authoritative nautical charts, such as NOAA charts in the U.S. I believe there are ways to do this without undermining the many unique and innovative charting products being offered.
“I define crowdsourcing as volunteered observations,” the admiral notes. “Crowdsourced bathymetry and navigation hazard reports are of primary interest to us. We have always received crowdsourced data, especially navigation hazard reports. But today’s mariners, enabled with GPS data streams and Internet-based technologies, can share huge volumes of information about their ocean environment, like water depths, very easily and inexpensively.”
Glang also reports that NOAA is working with the International Hydrographic Office to establish a crowdsourced bathymetry database. The database will be worldwide in coverage, and will enable information to be shared with anyone, but especially hydrographic offices, so that nautical charts can be improved.
“The two ways I see crowdsourced bathymetry as being useful to NOAA are first to inform us about the adequacy of our charts, and second, where we understand the limitations of the data, and perhaps no other data exists, we can consider applying it directly to the chart.” But, he adds, “Crowdsourced bathymetry will not replace the need for systematic and controlled hydrographic surveys in support of nautical charting.”
I think that most cruising sailors would agree that as far as chart data goes, it’s better to have too much than not enough. We should appreciate the possibilities of having newer, more detailed bottom information for poorly charted anchorages or areas where shoals can shift frequently, such as along the U.S. East Coast’s Intracoastal Waterway. At the very least, this growth in data sharing will hopefully mean a few less shoals around the world with our boats’ names on them.
Jen Brett is CW’s senior editor.
