Call it trickle-down electronics. For years, racing tacticians have fed wind, heading, location and speed data into PCs running routing and weather software to help anticipate wind shifts and determine laylines for tacking and jibing. Now electronics manufacturers are offering sailing-specific software with their multifunction displays, which can accomplish the same tasks and present the information in easy-to-understand graphics along with navigation charts at your helm or nav station.
In simple terms, the software lets you “see” the effects of wind and current, and will tell you, for instance, when it’s time to tack in order to sail through a pass or clear a channel marker. It will monitor wind speed and record gusts so you can better plan when to reef or roll out more sail, and it can calculate how long it will take for you to tack your way to a windward waypoint — all quite useful information when you’re in the midst of a voyage.
These advanced sailing features take advantage of information that most skippers already have at their disposal on various onboard gauges: data from the boat’s GPS and the autopilot’s flux-gate compass, wind speed from the anemometer, and boat speed through the water as measured by an impeller. What’s different is the way all this data is manipulated and presented. “It’s not calculating any data that’s not already available,” says Matt Fries, B&G’s business acquisition manager, about B&G’s advanced sailing features, which are found on the Vulcan chart plotter and the Zeus2 MFD. “Instead it takes this information and puts it into one easy-to-read display.”
The quantum leap that took sailors from celestial sights and paper charts to electronic navigation opened a Pandora’s box of useful information to help you sail more efficiently. Until recently, though, that data took a good deal of time and knowledge to decipher. Most boats these days have displays for speed over water (SOW) and speed over ground (SOG), true wind angle (TWA) and apparent wind angle (AWA), and heading information in either degrees true or magnetic. Early GPS units could combine some of these data feeds to estimate arrival times, distance to a waypoint and cross-track error. Chart plotters took things a step further by displaying all this as an overlay on electronic charts.
The new generation of MFDs goes a step further still by actually showing you what the wind and current are doing in the context of your position on an electronic chart. “Now software presentation can help people who can’t visualize the number part,” says Jon Josephson, Garmin’s Northwest sales manager, in describing the sailing features found on Garmin’s GPSMAP-series MFDs. “For a lot of people, the numbers are hard to understand. But when they can look at it on the chart, it’s a lot easier, and they don’t have to think through the math.”
Josephson says he’s noticed a trend toward getting rid of individual small numerical displays for things like boat and wind speed. Instead people want to see all the available data in one place, the MFD, and they want to see it displayed in a clear and concise way, allowing them to keep one eye on the telltales and one on the kids.
Currently B&G, Garmin and Raymarine have all developed data overlays for their sailing-focused MFDs. While each manufacturer offers its own proprietary features and screen views, they all generally share a few commonalities, including a wind rose, laylines and a starting-line assistant, as well as easy-to-read numbers that advise of both the time and distance to the next waypoint. Additional features can include a wind rose overlaid atop cartography; dampening (the ability to adjust the system’s sensitivity to compensate for choppy conditions); the option of integrating your boat’s performance polars; sharing networked information with third-party applications; and customizable data fields that can be used by third-party software to generate additional data — for example, forestay load, which can indicate when to adjust backstay tension.
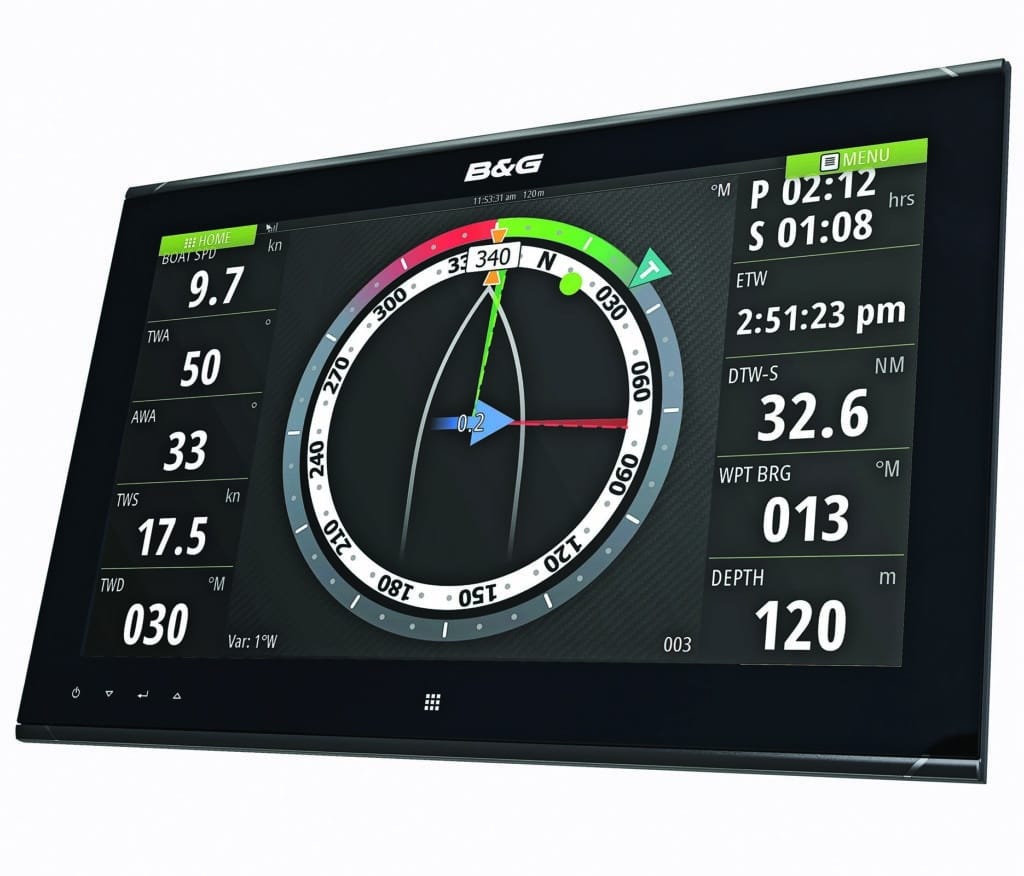
B&G turned heads in 2012 when it released its SailSteer feature on the Zeus Touch MFD. This handy wind-rose feature shows your vessel in a course-up orientation, with your heading information and your bearing to your next waypoint depicted on an inner ring, and true-wind and apparent-wind angles shown on the outer ring. In the center of the dynamic graphic are three additional pieces of information: the influence of current and tide, and your present- and opposite-tack laylines. A vessel’s set is depicted with an arrow, alongside its rate. On each side of the SailSteer page are numerical displays that indicate critical information such as course and speed over ground, your latitude and longitude, and the distance and time to your next waypoint.
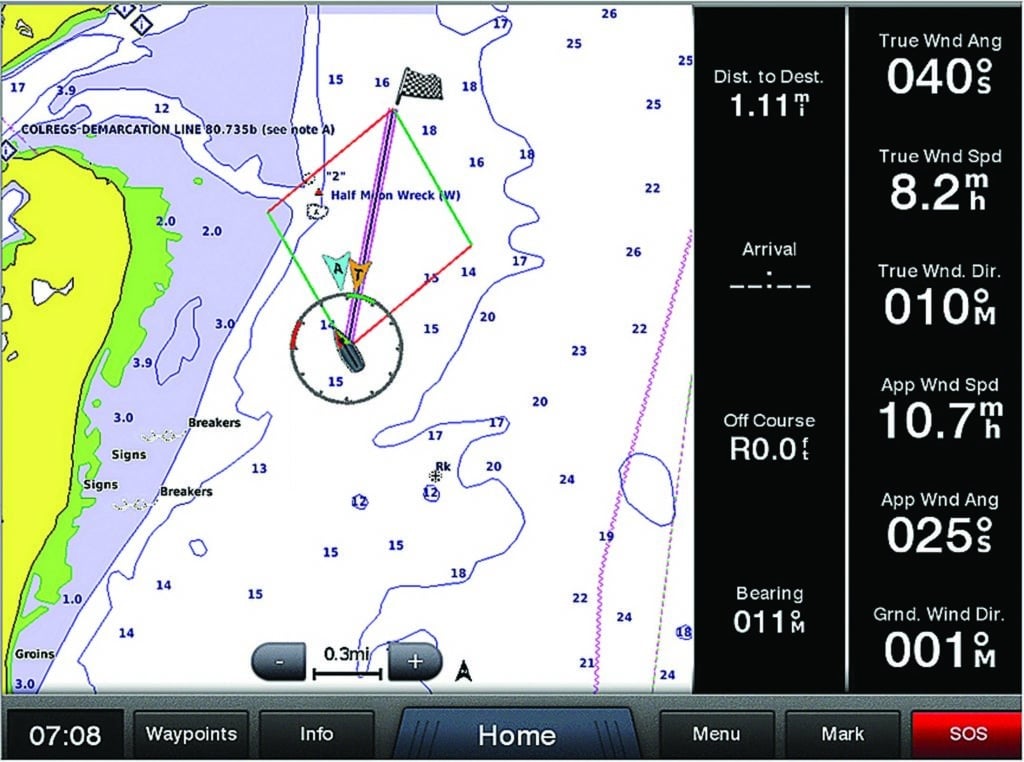
“Cruising sailors use laylines whether they know it or not,” says Fries. B&G now depicts laylines right on the chart, to make the decision of when to tack that much simpler. Using them will keep you from overstanding or having to pinch to make it past a hazard.
Garmin and Raymarine both also offer the ability to overlay an icon of your vessel onto your chart, while showing your layline options as well as a host of other pertinent navigational information. “Laylines give a graphical representation of where you are and where you want to go,” says Josephson. He notes that less experienced sailors often like the chart-overlay feature for their big-picture thinking.
“How you set up your tacks will make a huge difference,” he notes. It might take the same amount of time to arrive at a waypoint on either tack, but one route can be more comfortable. Additionally, seeing your laylines overlaid atop cartography can help you instantly evaluate whether one course is safer than the other — say, if a lee shore or skinny-water soundings are involved.
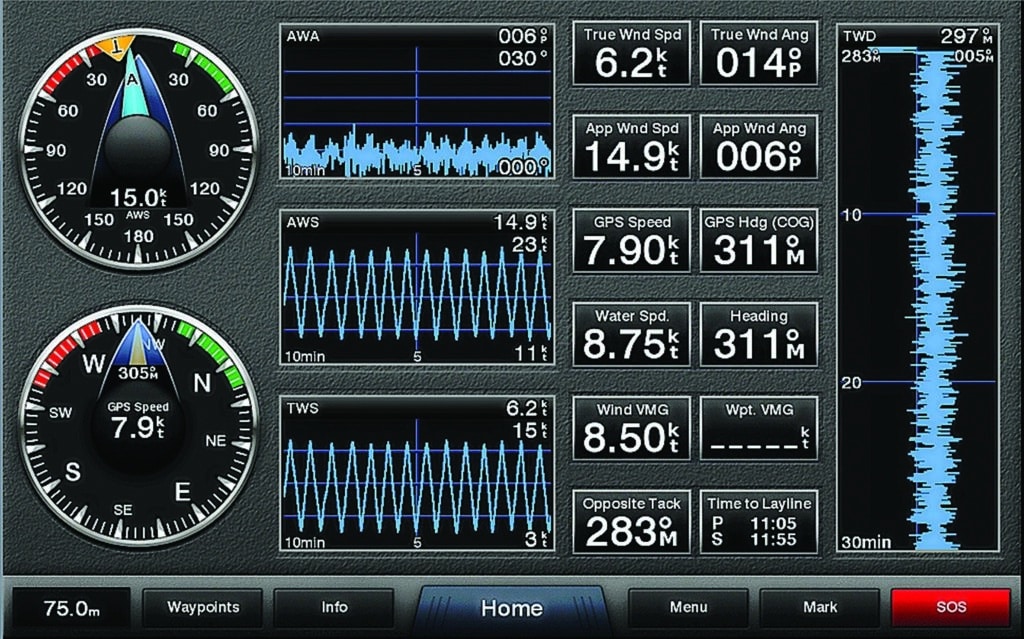
Wind is obviously a key ingredient for all sailors, and some of these systems offer historical wind data so you can visualize the wind building, veering or backing.
“The Limit Laylines feature allows a user to see with a quick glance if the wind is in a right or left phase, as well as the magnitude of the shifts,” says Fries. “Users can set the time limit — say, 15 minutes — and the MFD will show you the limits of the laylines as green or red zones.” Additionally, B&G’s latest software update for the Zeus2 MFD includes a What If function, which allows navigators to play with variables such as wind shifts and velocity changes, as well as sail selection if a vessel’s polars are being used. While racers can certainly capitalize on this feature, it’s also extremely useful to cruisers in determining if a header is expensive enough to warrant tacking, or if a lift is big enough to carry you to a waypoint that you’re struggling to fetch.
For the pure cruising sailor, the ability to hit a starting line on time and at pace is of little consequence, but for even the occasional racer, the starting-line assistants found on all three systems can be a big help. Depending on the system, users can ping either end of the starting line and then allow the MFD to provide information like line bias (finding the line’s favored end), time to burn before the start, the distance to either end of the line (as well as its closest point), and even tidal data.
Raymarine’s new LightHouse II operating system, which runs on its aSeries, cSeries, eSeries and gS Series MFDs, and which comes bundled with Raymarine’s Advanced Sailing Tools, allows you to easily key in a racecourse route based on published race-mark positions. “Users just take the race buoy’s two- to three-digit ID code and enter it into the plotter in advance,” says Jim McGowan, Raymarine’s marketing manager. “The system can also handle mark roundings, either port or starboard, right on the MFD.”
If starting from scratch, it makes sense to use input sensors and an MFD from the same manufacturer. But most boats will be equipped with instruments to collect basic data and transmit it to the MFD in either an NMEA 0183 or NMEA 2000 format. “All you need is a heading reference, position information and wind information,” says Josephson, who adds that all that data is available from a GPS and anemometer. To get better results, you’ll also need to monitor speed over water.
It goes without saying that the quality of the data being graphically displayed depends entirely on the quality of the information that’s going into the MFD, so it’s critical that your instrumentation is properly calibrated.
With the proper gear installed, the sailing features found on modern MFDs will give skippers access to a wealth of tactical information displayed on easily digestible graphical screens. Cruisers can instantly quantify the impact of any sailhandling or course changes they make, while also increasing their understanding of racing-related wisdom such as wind phases and laylines. Overall, these new MFD programs improve a sailor’s situational awareness and, ideally, reduce the amount of time spent on long beats in rough weather.
David Schmidt is CW’s electronics editor.