What cruiser hasn’t blamed a meteorologist for a bad forecast when caught “unexpectedly” in a boisterous blow? “It was only supposed to be 15 knots, but that forecaster couldn’t get it right if Mother Nature shouted the answer.”
Supposed to be—as if a forecast were instructions for atmosphere and ocean to follow. I have a whimsical theory, in fact: Impugned for ruined weddings and rough days on the water, clever and dedicated meteorologists created computer-derived weather forecasts packed into a digital file called a gridded binary, or GRIB file. These GRIB forecasts deflect hurtful sentiments away from sensitive scientists and onto emotionless computers—and that’s how meteorologists get the last laugh: The various computer models require an understanding of how the data should be interpreted. In other words, a faulty forecast might be user error after all.
Picture, if you will, weather geeks in a breakroom, pocket protectors and all:
Wx Geek 1: “So this saltier- than-thou type returned to the marina complaining about the GRIB forecast—it was only supposed to be 15 knots he said.”
Wx Geek 2: “Let me guess, he thought that meant maximum wind speed?”
Wx Geek 1: “Better still, he never checked the gust forecast that showed 30 knots!”
Cruising our Stevens 47, Totem, through Papua New Guinea was a stark reminder that we take weather tools for granted. On Panapompom Island, children gawked at us, the strange visitors, and squalls seemed always on the horizon as we walked the beach talking to islanders. Tumbling in the surf was the carved bow section torn from a canoe. Lateen-rigged outrigger canoes are the primary mode of transportation throughout Papuan islands. One woman matter-of-factly said, “Sometimes they don’t return.”
Conditions in the region were tough due to a stalled low-pressure system. We expected it well before heavy grayscale clouds arrived, thanks to a GRIB forecast downloaded with our SSB and Pactor modem. Papuan sailors are skilled and tough as nails, but the destroyed canoe in the surf exposed the consequences of a thousand-year technological gap between us.
Safety at sea is immeasurably better because of weather forecasting. Weather predictions are imperfect, but here’s the catch: GRIB forecasts are a series of images with symbolic meaning; the forecast is how you interpret those images. Put another way, you are the forecaster.
Van Gogh’s “Starry Night” has nothing to do with weather forecasting, but the celestial whorls share more than passing resemblance to the swirling flows in a GRIB image. My untrained interpretation of “Starry Night” is thin: captivating colors that seem alive with movement. That’s all I’ve got. Professional interpretations online speak of turbulence, agitation, a cypress tree representing a bridge between life and death. It’s easy to have an interpretation of GRIB images, but is it the whole meaning? Or do you need to dig deeper?
A GRIB Is Not an App!
There are a number of meteorological agencies worldwide that create global and regional GRIB forecasts. Agencies within the National Ocean and Atmospheric Administration and the European Center for Medium-Range Weather Forecasting are the biggest GRIB sources. Each produces multiple forecasts, called GRIB models. For example, a few of the GRIB models created by NOAA agencies include:
- Global Forecast System, depicting surface wind, pressure, precipitation, etc.
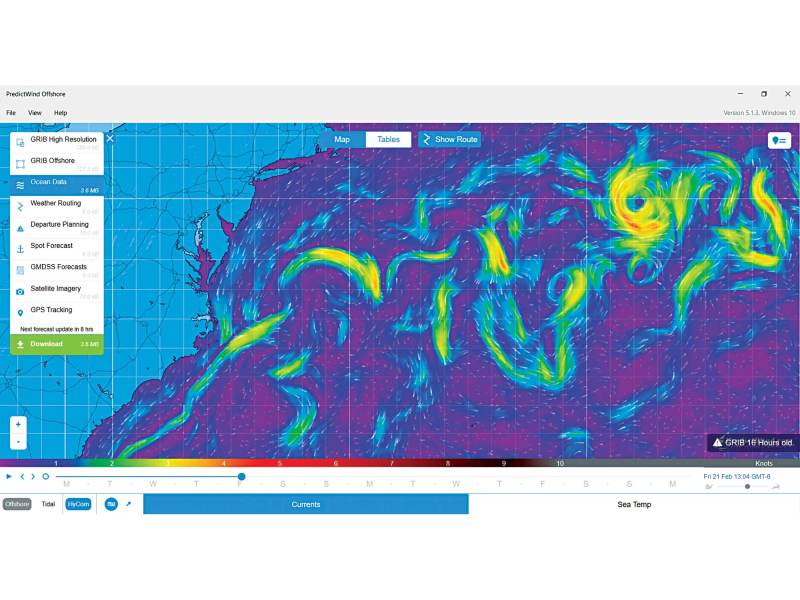
- Real Time Ocean Forecast System, displaying ocean currents.
- Wave Watch 3, predicting waves and swells.
In addition to national sources, private companies produce GRIBs, such as PredictWind’s PWE and PWG models. On the whole, it’s a dizzying display of acronyms! The takeaway is knowing that GRIB sources and GRIB models are different than the app or viewing tool.
Windy, Passage Weather, Ventusky and many other apps/viewers don’t create a GRIB forecast, they only display it. An app is like a theater, and the GRIB model is the film being shown.
GRIB viewers are set apart based on which models they offer and what control features are available. Maybe they show only one model, or don’t reveal important information about the GRIB. Or perhaps they don’t have the option to limit file sizes for offshore or remote downloads using a satellite device or Pactor Modem.
When choosing and analyzing GRIB files, here are technical criteria to consider:
Geographic area: The bigger the forecast area, the bigger the file size. If bandwidth is constrained, it’s best to use a GRIB viewer that enables a user-defined area to manage download size. How much area do you need? Your planned route is the obvious starting point, but sometimes a broader area can show weather systems that will affect you later.
In 2016, we sailed 9,614 nautical miles from South Africa to the US. Between Bermuda and Connecticut, a maze of current eddies, meanders and filaments splintered away from the Gulf Stream to make it one of our least comfortable passages. We used GRIB current forecasts to minimize foul eddies and wind against current situations, but water flow was too dynamic. Had I not been so miserly and insistent on small area, small file size, I might have seen current flow patterns to pick a cleaner, more comfortable path.
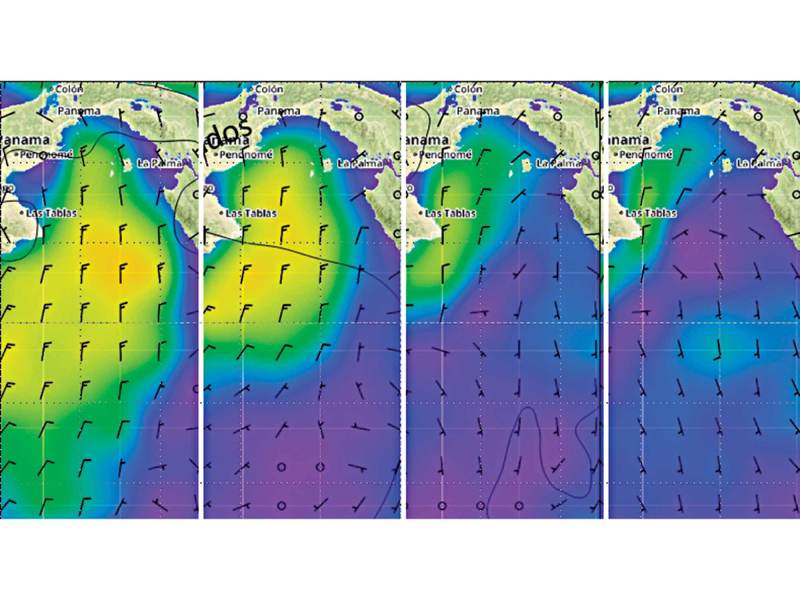
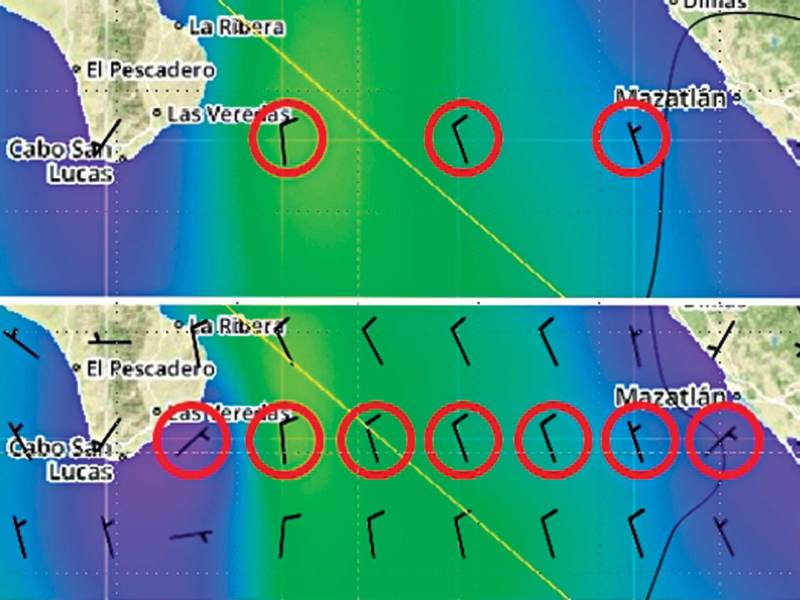
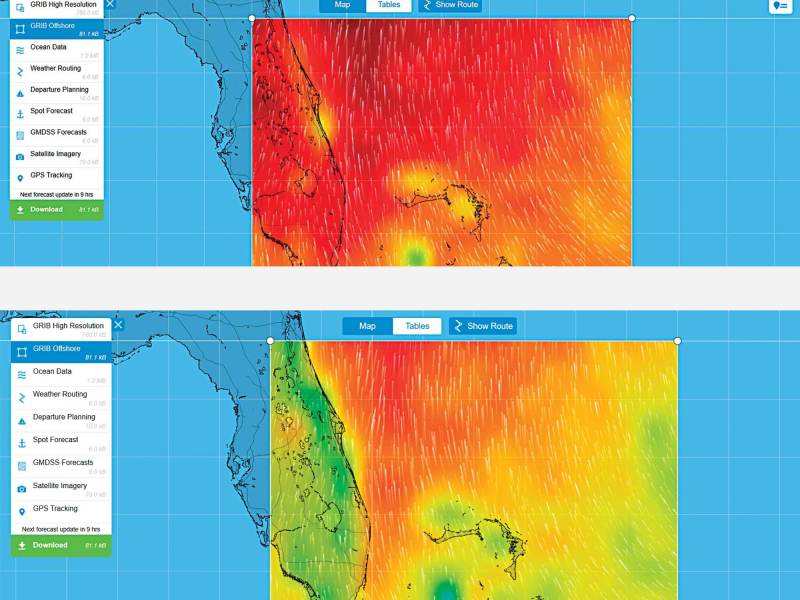
Resolution: Often overlooked, GRIB resolution is a major reason that cruisers get the forecast wrong. The color shading on GRIBs applied by some viewers is used to represent wind speed, wave height, etc. At first glance, it appears as though a supercomputer calculated forecast data for every pixel on the screen. But it hasn’t. Resolution refers to the spacing between the actual calculated data points. Wind-barb symbols, when shown, reveal the real spacing. All spaces between them are shaded by the viewer, which is making its best guess at what the wind speed will be. At the source, GFS model resolution is 18 miles (28 kilometers) and ECMWF models can be 5.6 miles (9 kilometers) or 11.2 miles (18 kilometers), depending on the model. For perspective, 18 miles’ resolution means that one data point represents 324 square miles. One data point per 5.6-mile spacing covers 31 square miles. High resolution means less estimated information but creates a problem for sailors. The GRIB file size quickly becomes too large to download offshore or in remote areas using an SSB radio or budget satellite communications. Fortunately, GRIB resolution can be dialed back. A medium resolution of 31 miles (50 kilometers) has one data point per 961 square miles; low-resolution spacing, with data points 62 miles apart (100 kilometers) has one data point per a whopping 3,844 square miles! If there aren’t features in a 3,844-square-mile area affecting your weather, then that might be all you need. Add land, though, and the low-resolution forecast won’t show wind deflected, blocked or funneled—or seriously altered as land heats and cools on a daily cycle. Along a coastline, the gap between data points that span land and sea, and estimated wind speeds displayed by a viewer’s color shading, can be seriously flawed with low resolution. The overland prediction often has little resemblance to wind over water. With big spacing, the viewer’s color shading could, for example, show 30 knots of wind 30 miles offshore and 10 knots nearshore because the overland data points skew the speed estimates in between data points. In reality, those 30 knots could carry to just off the coast, causing problems for a coastal sailor. Always know GRIB resolution, and use high resolution when you have the bandwidth on board. When you don’t, remember that land has a big impact on any forecast.
Duration: The number of days covered by the forecast is known as duration. It can range from one to 16 days. Forecast accuracy tends to be high for the first three days, then decline with each successive day. What value does a 16-day forecast have if only the first three are accurate? It can show trends.
Let’s say you’re in the British Virgin Islands and want to make the 170-mile trip to Antigua. This is against prevailing easterly trade winds and can be a slog. Looking at longer-duration forecasts reveals trends that help find a better window for the passage. Trade winds blow with consistency but still cycle up and down, and occasionally break down completely. Using a large-area and long-duration GRIB forecast, tracking weather across the broader area can hint at local conditions days later. For instance, maybe a gale flowing east from the Carolinas will have enough impact to shut down the trade winds for a smoother ride across the Anegada Passage.
Increment: A GRIB forecast is a series of snapshots; increment refers to the number of hours between those snapshots. Options are three, six, 12 or 24 hours. Smaller increments help to show changes more clearly over small areas. Larger increments have the benefit of smaller file size while being adequate to look at trends over a large area.
Work with the Elements
The features that define the forecast are its elements. Wind is the most common used by sailors. It’s a start, but taken at face value, is misleading. Taken without considering other elements underutilizes the full value of GRIB files. Here are tips to get the most out of a GRIB forecast:
Pressure: Differences in pressure make wind. To see this, look at the black lines on a GRIB indicating pressure changes. As the gradient spacing gets closer, the wind increases. Use pressure to better see the big-picture weather.
Wind: How much does the forecast really indicate? Forecasted wind speed tends to be interpreted by sailors as representing the maximum expected, but in fact, is an average of the top range expected. A blustery spring day showing 20 knots can have wind ranging meaningfully higher and still fit the forecast. Also note that wind forecasts struggle for accuracy in whisper-light conditions.
Gust: Short bursts of higher wind speed can be much different than the wind forecast. Ignoring the gust forecast is disregarding an excellent indicator of what the highest winds might be. Comparing wind and gust forecasts is a gauge of volatility: the larger the difference between them, the less stable conditions are.
Waves: Sea state affects comfort on board more than wind. Unfortunately, sea-state forecasts require the most experience to conjure an interpretation. Wave forecasts predict height, direction and period. Height is not the maximum size but rather the average significant height. Waves forecast to be 6 feet can have a 1-in-1,000 wave that is 10 feet.
Forecasts don’t quite capture the “real-feel” out there. Prediction algorithms don’t account for local factors such as coastal topography and bottom contours that amplify size, compress period, or make sea state erratic and confused. Multidirection sea states are common offshore but don’t make GRIB forecasts either. To better interpret wave forecasts, consider the things that push and shove water out of pattern.
Current: Along the coast, tide charts are useful for routing with a speed advantage. Ocean currents are often forgotten about, their forecasts underutilized. Ocean currents are often irregular and shifty, but they are worth identifying to route for efficiency and avoid uncomfortable sea states created by conflicting flows of wind and current.
Rain: A GRIB rain forecast indicates if it’s time to dust off the foul-weather gear. It has more value as a gauge of volatility. Rain is indicated by inches or millimeters per hour. High rainfall tends to be part of volatile weather conditions.
CAPE: This is an acronym for convective available potential energy. It’s a measure of atmospheric instability, such as thunderstorms and squalls. A high CAPE index doesn’t guarantee their formation but indicates their intensity.
Cloud: A GRIB cloud forecast is a good indicator of visibility when sailing at night with little moonlight. It also might highlight an area of volatile weather such as a frontal system or trough.
Indexing: Using a single GRIB model might show the best forecast available. It also might show the worst. Looking at multiple GRIB models sets up a problem: When they differ, how do you know which has the better prediction? I’ve listened in on some group-think weather discussions where a participant pushed a particular forecast. Turns out that this GRIB best fit their schedule, so they wanted it to be true. That’s gambling. A better method to follow is what I call indexing the models.
The idea is simple. Study the GRIB models you have available. When they all agree on conditions, the real weather is likely to be as forecast. When they don’t agree, watch the real weather and make a note of which models trend closest to reality. A pattern will emerge. If you sail to a different region or slide into a different season, then re-index because the most accurate model might change. There might not be a single winner, but one model might be better for wind and gusts, and another for the rain or CAPE. When we crossed the Indian Ocean, PredictWind’s PWE was best by far for wind, GFS was best for rain and CAPE forecasts, and ECMWF was the best read of sea state. It took a little more work to download and view them all, but it made for a sweet trip across a lively ocean.
Just as it’s important to start with multiple GRIB models, it’s best to use multiple forecast resources when facing challenging passages. GRIBs give us convenient information anytime or anywhere, but always remember that you are the forecaster. If that makes you uncomfortable, consider the aid of a professional meteorologist to interpret the data for you. Hiring a weather router is a smart way to start cruising with better weather information, while learning in the process. Just don’t complain when results are imperfect! It’s a tall order to predict the future.
Jamie Gifford is a sailmaker, and along with his wife, Behan, provides coaching to fledgling cruisers. The Giffords have completed one eight-year circumnavigation aboard their Stevens 47 Totem, and are about to set off across the Pacific again. You can follow their travels at cruisngworld.com/sailing-totem.


